|
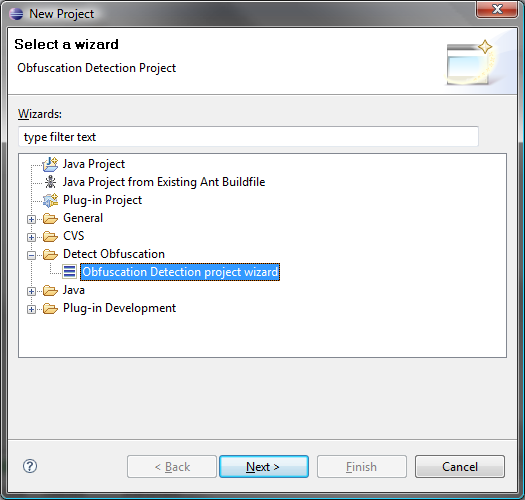
Creating a New Project
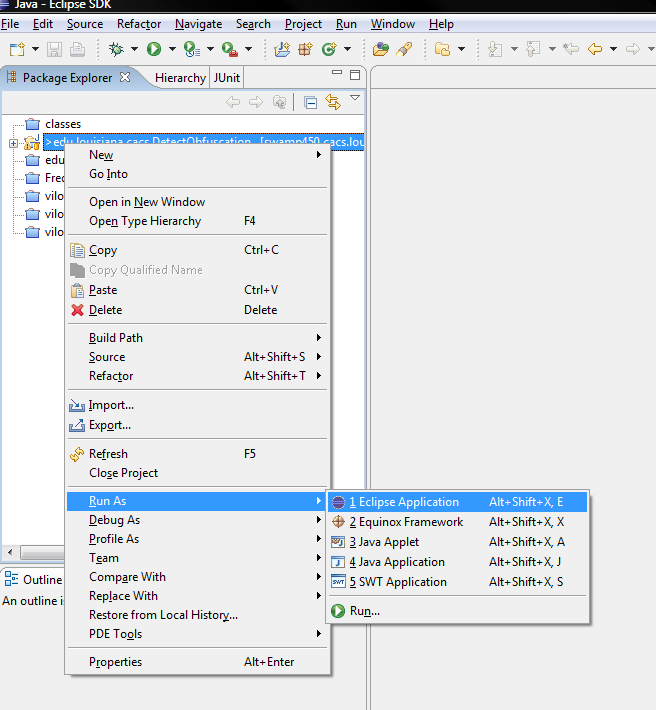
The application must be launched as an Eclipse application. To do this, right-click the project
and select
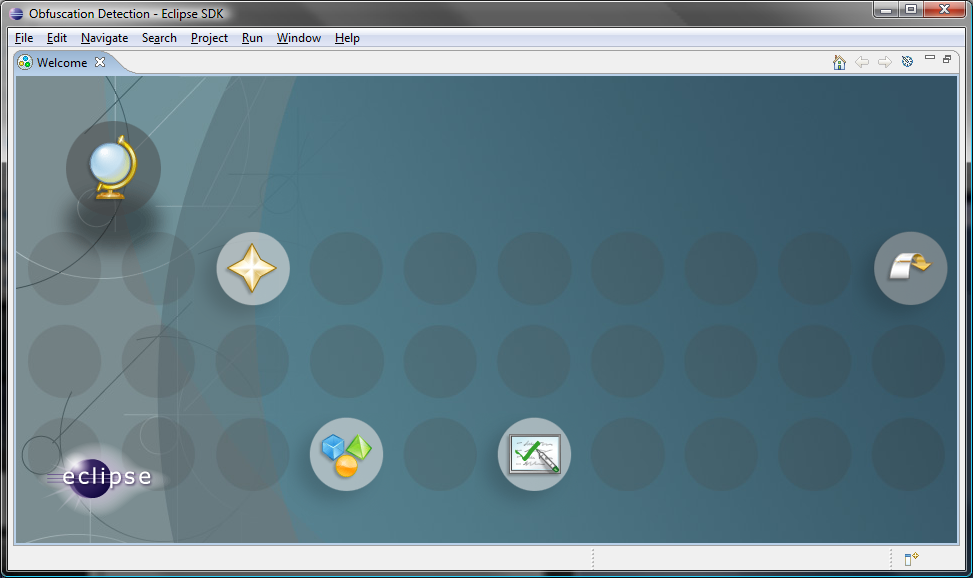
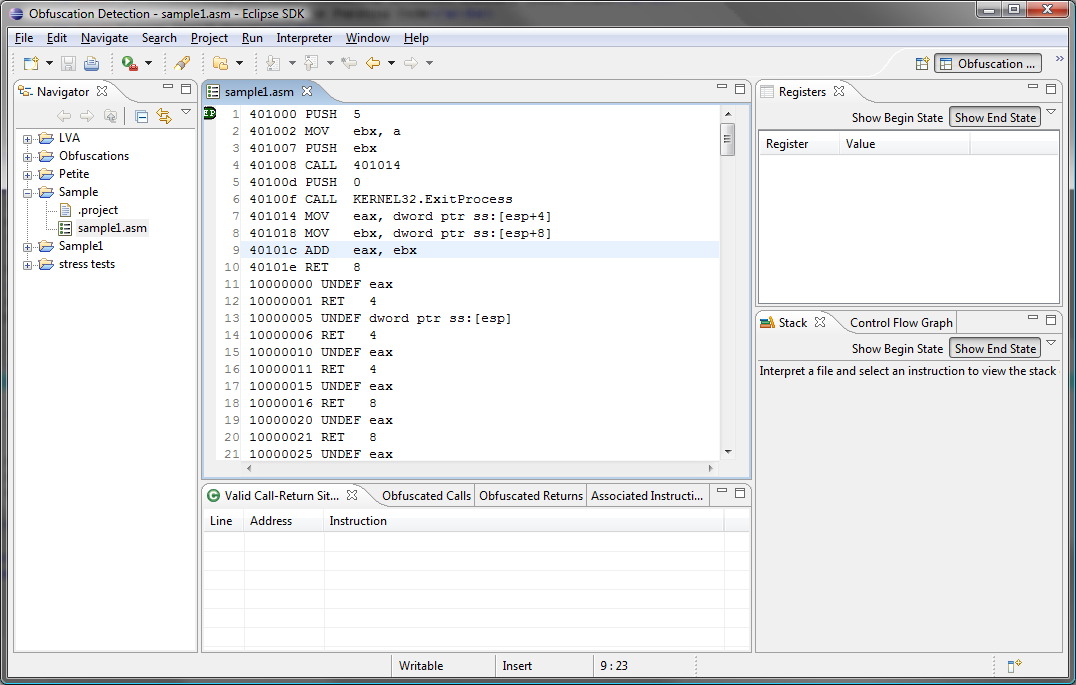
At the DOC interface (screenshot), open a new file for interpretation
by selecting Running the Interpreter
To interpret the file using the abstract stack graph with value-set analysis, select
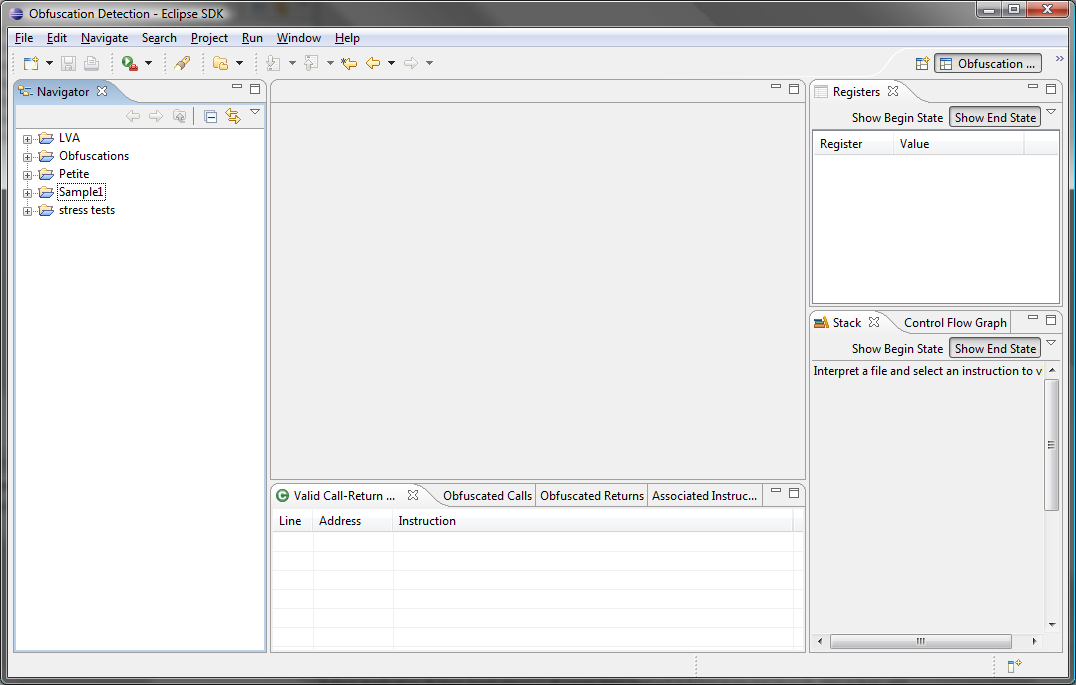
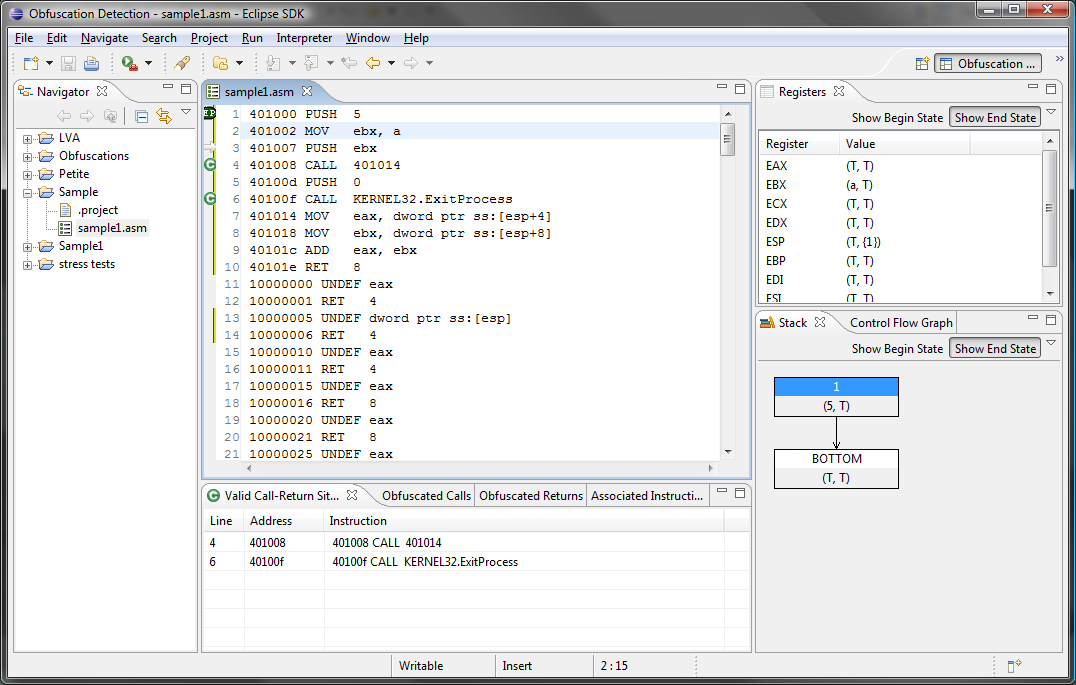
Navigating the Resulting FileAfter performing abstract interpretation, the interface is updated to include several annotations to the assembly listing, a listing of register values, and a representation of the abstract stack (screenshot). Selecting an instruction in the assembly listing updates the register and stack display. By moving through the instruction line by line, you can see how each instruction affects the state of the system. The bottom of the screen consists of tabs for valid call-return sites, obfuscated call sites, and obfuscated return sites. From here, you can easily find obfuscated calls and returns. Understanding the ResultsHopefully the user interface will be mostly intuitive. One area that needs some explanation is how the register and stack values are displayed. On a real system, each value is represented as a 32- or 64-bit number. In an abstract interpreter, each real value is represented by an abstract value. For DOC, that abstract value is a combination of a reduce-interval congruence (RIC) along with a stack location. This will be briefly covered here; for more information, please see our published papers.
A register can hold either a number or a memory address. To represent a number, DOC uses the
RIC. An RIC consisely represents a set of numbers. Thus, if an instruction places a number in
a register, that number will be represented with an RIC. On the other hand, the instruction might
place a memory address in the register. If the memory address belongs to the stack (for example,
an instruction like
To illustrate how the values work, look at the
screenshot, the value in register
As another example, look at register
Many of the registers are given the value |